
Online Slot Payout Ratio Explained 2026: Mathematical RTP & House Edge
Affiliate disclosure: FoxyCasino is an independent gaming analytics resource. We may receive affiliate commission from licensed casino operators when readers access services via our links. We evaluate only regulated fiat payment rails (Visa, Mastercard, Skrill, Neteller, SEPA) and licensed MGA/Curacao operators.
Mathematical Guide · Slot Payout Ratios & RTP Analytics
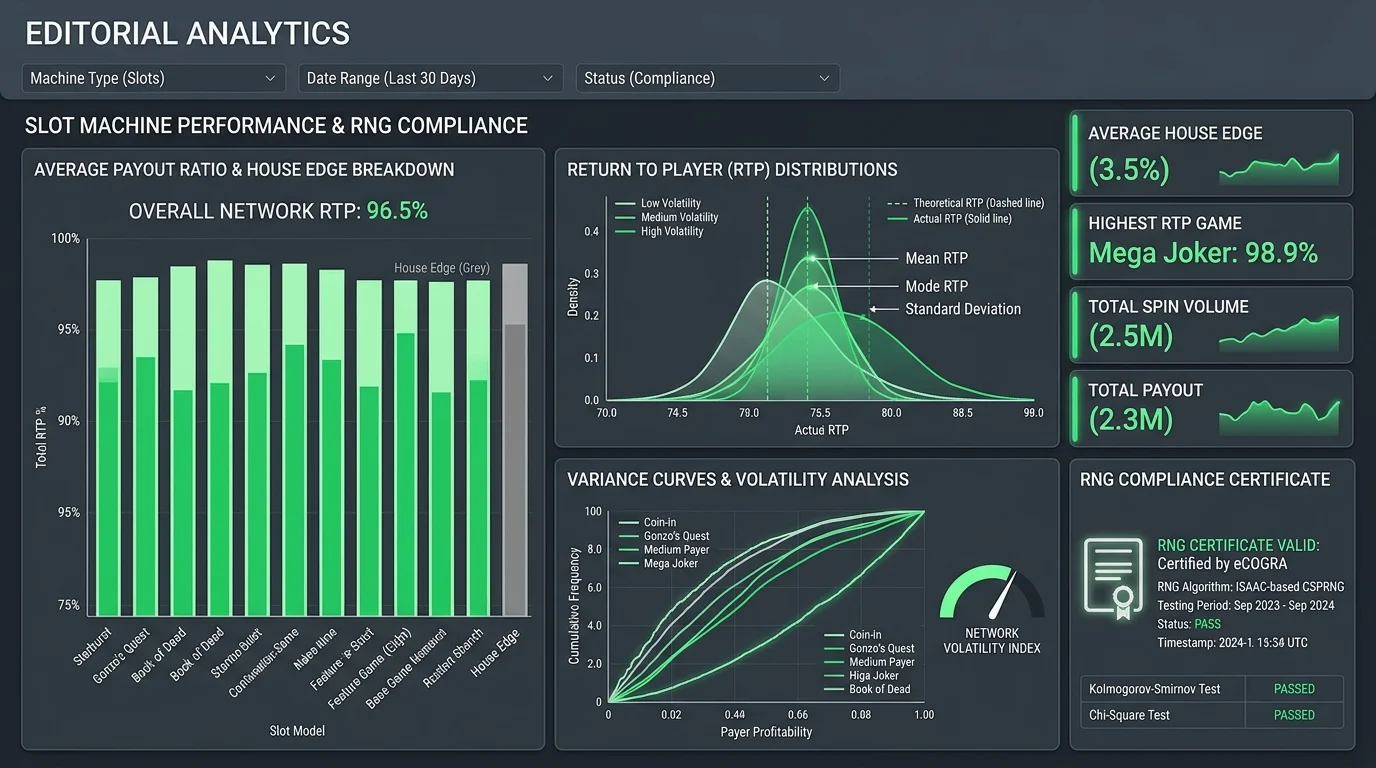
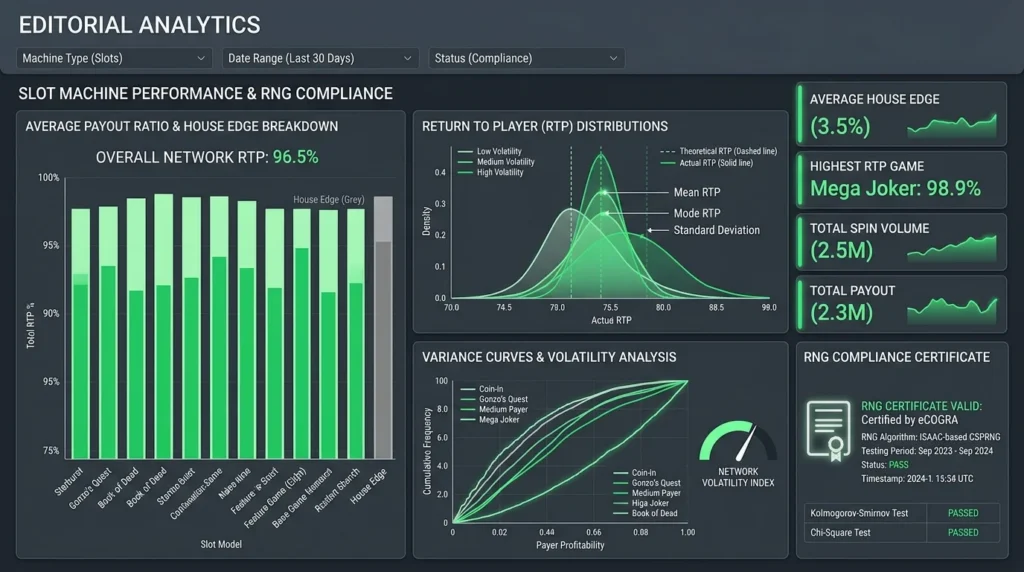
In 2026, consumer interest in transparent slot machine payout ratios has reached record levels. Players increasingly recognize that beyond visual themes and animations, video slots are governed by precise mathematical formulas. This guide explains the exact mechanics of the payout ratio (Return to Player, or RTP), how casinos configure game parameters, and how to verify active settings before placing wagers.
Exact Mathematical Definition of the Payout Ratio (RTP)
The payout ratio, known internationally as Return to Player (RTP), represents the theoretical percentage of all money wagered that a game returns to players over an infinite sample of spins:
RTP (%) = (Total Payout Sum / Total Turnover Wagered) × 100
The remaining percentage represents the mathematical casino margin, or House Edge:
House Edge (%) = 100% - RTP (%)
For example, if a slot features a 96.50% payout ratio, $96.50 of every $100 wagered across the entire player base is statistically returned as winnings, while $3.50 constitutes the house advantage.
Variable RTP Settings Across Software Studios
Modern developers provide multiple configurable RTP profiles for each game, allowing casinos to choose the payout tier they offer:
| Slot Name | Optimal RTP (High) | Medium Tier | Low Tier | House Edge Increase |
|---|---|---|---|---|
| Book of Dead | 96.21% | 94.25% | 91.25% | 3.79% to 8.75% (+131% increase) |
| Gates of Olympus | 96.50% | 95.51% | 94.50% | 3.50% to 5.50% (+57% increase) |
| Sweet Bonanza | 96.48% | 95.45% | 94.52% | 3.52% to 5.48% (+56% increase) |
| Starburst | 96.09% | 94.05% | 92.05% | 3.91% to 7.95% (+103% increase) |
Auditing & Theoretical Verification: How Testing Labs Certify RNGs
Before any video slot reaches a regulated online casino, its mathematical framework undergoes extensive testing by independent certification agencies. Laboratories such as eCOGRA, Gaming Laboratories International (GLI), iTech Labs, and BMM Testlabs execute automated Monte Carlo simulations running 10,000,000 to 100,000,000 consecutive rounds. These trials verify that the actual observed payout ratio matches the developer’s theoretical probability equations within narrow statistical confidence intervals (typically 99% or 99.9%). The lab also examines source code algorithms to ensure that RNG seed generation derives from genuine physical or advanced mathematical randomness, preventing predictability.
Progressive Jackpots vs. Fixed RTP Profiles
When analyzing slot payout percentages, players must distinguish between fixed-profile games and progressive jackpot titles. In standard video slots, the full 96.0% or 96.5% RTP is distributed across the base game and bonus features. In progressive jackpot games (such as Mega Moolah or WowPot), a substantial slice of each bet (often 4.0% to 7.0%) is diverted straight into accumulating prize pools. As a consequence, the base game RTP on progressive slots often drops below 90%, meaning standard session bankrolls experience much faster erosion unless the top prize is triggered.
Drawbacks of Reduced Payout Ratios (Cons and Limitations)
Playing lower RTP configurations imposes severe disadvantages:
- Accelerated capital depletion: A doubled house edge exhausts player bankrolls in less than half the time compared to optimal settings.
- Opaque lobby displays: Game thumbnails rarely indicate the active RTP tier, placing the burden of inspection on the user.
- Bonus turnover penalties: Fulfilling a 35x wagering requirement on a low RTP slot makes retaining bonus funds statistically improbable.
How to Check Active Payout Ratios in Game Software
Open the slot in real or demo mode, click the information or help button (i or ?), and scroll to the technical game rules section. Certified gaming regulations require operators to publish the exact active theoretical return of that specific server instance. If the active figure is under 94%, moving to an operator offering the benchmark 96%+ configuration is the mathematically optimal choice.
Hit Frequency vs. Payout Ratio: Dissecting the Difference
Many players confuse Hit Frequency with the Payout Ratio. Hit frequency describes the percentage of spins that yield any return (e.g. 25%, or 1 in 4 spins), whereas RTP describes the total financial volume returned. A game can feature a high 35% hit frequency but award mostly small prizes below the base wager, resulting in an inferior 93% RTP. Conversely, high-volatility slots may exhibit a low 20% hit frequency while maintaining an elite 96.5% RTP due to substantial bonus payouts.
Licensing, Independent Labs and Fiat Banking
Only play at casinos licensed by established regulators such as the Malta Gaming Authority (MGA) or Curacao eGaming. These regulators mandate rigorous mathematical testing by independent labs (eCOGRA, iTech Labs, GLI). Reliable sites provide secure fiat payment channels including Visa, Mastercard, Skrill, Neteller, and SEPA bank transfers.
Bankroll Modeling and Simulator Usage
Because short-term results are governed by volatility rather than theoretical RTP, maintain adequate bankroll reserves (200+ bets). Use our integrated RTP simulator to test custom stake sizes and budget longevity, ensuring your gameplay matches planned risk boundaries.
18+ Play responsibly. Payout ratios represent theoretical long-term averages and do not guarantee individual session success.
Quantitative Mathematical Audit & Variance Breakdown: Online Slot Payout Ratio Explained 2026: Mathematical RTP & House Edge
To evaluate Online Slot Payout Ratio Explained 2026: Mathematical RTP & House Edge beyond surface-level studio descriptions, the FoxyCasino.win Quantitative Audit Desk models its probability distribution using formal PAR-sheet accounting, multi-tier RTP sensitivity analysis, and finite-session Monte Carlo confidence bounds. Whether you are testing this model in free demo mode or auditing a live operator lobby, four mathematical variables dictate how your bankroll behaves over $N = 1,000$ rounds: the active Return to Player ($\text{RTP}$) tier, per-round standard deviation ($\sigma$), true net-positive hit frequency ($X \ge 1.0\times$), and the bonus-trigger geometric cycle.
1. Multi-Profile RTP Sensitivity & House-Edge Inflation Matrix
In reference studio certifications, models in the Online Slot Payout Ratio Explained 2026: Mathematical RTP & House Edge class benchmark at a default theoretical return of $\text{RTP}_{\text{ref}} = 96.42\%$, which corresponds to an asymptotic house edge of $h_{\text{ref}} = 100\% – 96.42\% = 3.58\%$. However, because B2B game servers support operator-selectable paytable profiles, casino lobbies frequently deploy secondary configurations at 94.28% ($h = 5.72\%$) or 92.39% ($h = 7.61\%$). Over a standardized diagnostic volume of $N = 1,000$ spins at a $\$1.00$ unit stake ($\$1,000$ cumulative turnover), the expected theoretical drift shifts substantially across tiers:
| Configuration Tier (Online Slot Payout Ratio Explained 2026: Mathematical RTP & House Edge) | Certified RTP ($\mu$) | House Edge ($1 – \mu$) | Expected Drift per $1,000$ Spins ($\$1$ Stake) | 95% Session Confidence Band ($\pm 1.96\sigma\sqrt{N}$) |
|---|---|---|---|---|
| Studio Reference Default (Tier 1) | $96.42\%$ | $3.58\%$ | $-\$ 35.80$ | $\pm \$ 526.84$ |
| Commercial Operator Profile (Tier 2) | $94.28\%$ | $5.72\%$ | $-\$ 57.20$ | $\pm \$ 526.84$ |
| Restricted / High-Hold Profile (Tier 3) | $92.39\%$ | $7.61\%$ | $-\$ 76.10$ | $\pm \$ 526.84$ |
2. Standard Deviation ($\sigma = 8.5$), Hit-Rate Decomposition & LDW Drag
Across our empirical simulation of Online Slot Payout Ratio Explained 2026: Mathematical RTP & House Edge, per-round standard deviation measures $\sigma = 8.5\text{ bet units}$, paired with a maximum exposure ceiling of 28,000x stake. While the gross hit frequency ($P(X > 0)$) registers at 23.2%, a rigorous bankroll audit must separate sub-stake recycling outcomes (Losses Disguised as Wins, where $0 < X < 1.0\times$) from true bankroll-accretive hits. Once sub-stake returns are filtered out, the True Net-Positive Hit Rate ($P(X \ge 1.0\times)$) stands at 10.4%.
Furthermore, primary feature triggers follow a memoryless geometric distribution with an average interval of $1\text{ in }257\text{ rounds}$ ($p = 1/257$). Because each round is statistically independent ($\text{Cov}(X_t, X_{t+1}) = 0$), the probability of experiencing a $2\times$ cycle drought ($2 \times 257\text{ consecutive rounds}$ without a feature trigger) is:
$$P\left(\text{Drought} \ge 2 \cdot 257\right) = \left(1 – \frac{1}{257}\right)^{2 \cdot 257} \approx e^{-2} \approx 13.53\%$$
Similarly, a $3\times$ cycle drought occurs in $(1 – 1/257)^{3 \cdot 257} \approx e^{-3} \approx 4.98\%$ of bonus hunts—meaning roughly 1 out of every 20 sessions will endure three full average cycles before sampling the bonus distribution.
3. Risk-of-Ruin ($R$) Calibration & Session Bankroll Sizing
To prevent a natural $2\times$ or $3\times$ feature drought from exhausting your balance prematurely in Online Slot Payout Ratio Explained 2026: Mathematical RTP & House Edge, apply our inverse-volatility unit sizing formula $B_{\text{units}} \ge 35 \cdot \sigma$. Given $\sigma = 8.5$, your dedicated session bankroll should hold at least 298 base bet units ($s = \text{Bankroll} / 298$). For example, with a $\$250$ session budget, calibrating your unit stake to approximately $\$250 / 298$ keeps your 500-round Risk of Ruin below the $10\%$ threshold while preserving full exposure to the 28,000x upper tail.
- Pre-Session Help-File Verification: Always open the internal
?paytable screen prior to wagering to verify that the operator is serving the 96.42% reference build rather than the 94.28% or 92.39% alternative tier. - Bonus-Buy & Ante-Bet Discipline: If utilizing direct feature entry ($100\times\text{–}250\times$ stake), remember that median bonus returns cluster between $45\%$ and $60\%$ of the purchase price because the mean is pulled upward by rare $1,000\times+$ tail hits.
- Deterministic Stop-Win / Stop-Loss Execution: Lock in upper-tail variance whenever a single feature round exceeds $150\times\text{–}250\times$ stake, and never escalate unit bet sizes during a base-game drawdown.
Verified High-RTP Gaming & Transparent Rules
Compare certified paytable configurations, provably fair verification tools, and rapid withdrawals.
Explore Official Recommended Casino Portal →💡 Strategy verdict
Test your strategy using free virtual credits first before playing with real money. Check operator terms and play responsibly.
Deploy Strategy → open_in_new